


About Dew Point Calculation
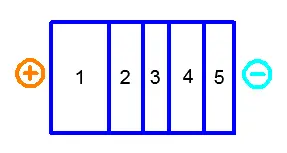
This dew point calculator estimates the risk of interstitial moisture condensation in a multi-layer building envelope using a simplified steady-state Glaser-type method. The result is shown as charts of temperature and water vapor partial pressure distribution through the construction thickness.
The calculation is useful for comparing wall or roof build-ups. It helps identify in which layer, or at which layer interface, a possible condensation zone may occur for the given indoor and outdoor conditions.
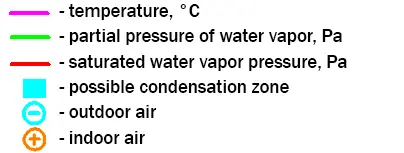
Purple - temperature T(x), °C.
Green - actual water vapor partial pressure e(x), Pa.
Red - saturated water vapor pressure Esat(T(x)), Pa (no-condensation limit).
Reference values and recommendations
Standards and assumptions
Calculation method. A one-dimensional steady-state approach (Glaser) is used. Heat transfer is assumed steady through the thickness. Water vapor transport is assumed steady and driven by diffusion.
Standards and documents. The calculation logic follows the general approach of EN ISO 13788 (assessment of interstitial condensation using a steady-state scheme). For typical internal and external surface thermal resistances, see EN ISO 6946.
Model limitations. The calculation does not include capillary moisture transport, air leakage convection, rain wetting, solar drying, or changing weather. It is intended for an initial check and for comparing build-up options.
Step 1. Temperature field from thermal resistances
Layer thermal resistance. For each layer, thermal resistance is calculated from thickness d and thermal conductivity λ.
Ri=di/λi
Units and consistency. Layer thickness is entered in mm and thermal conductivity in W/(m·K). The temperature profile uses the ratio Rcum/Rtot, so consistency across layers is essential. If you compare with tabulated R values in m²·K/W, use thickness in meters in the formula.
Surface resistances. If surface resistances are included, typical values for a vertical wall are used.
Rsi=0.13 m²·K/W Rse=0.04 m²·K/W
Interface temperatures. The temperature at each layer interface is determined in proportion to the cumulative resistance from the internal surface to that interface, given indoor Tin and outdoor Tout temperatures.
T(x)=Tin-(Tin-Tout)·Rcum(x)/Rtot
Step 2. Saturation vapor pressure as the no-condensation limit
Physical meaning. For each point in the construction, the maximum possible water vapor pressure in the pore air without condensation is determined from the local temperature T(x). This value is called the saturation water vapor pressure.
Esat(x)=Esat(T(x))
Units. Esat is shown in Pa. The function Esat(T) is taken from a commonly used saturation-pressure temperature relationship.
Step 3. Water vapor partial pressure from diffusion resistances
Boundary partial pressures. On the indoor and outdoor sides, partial pressure is calculated from relative humidity φ and the saturation pressure at the corresponding temperature.
ein=φin/100·Esat(Tin)
eout=φout/100·Esat(Tout)
Layer diffusion resistance. For each layer, diffusion resistance is calculated from thickness d and vapor permeability δ.
Zi=di/δi
Units. In this calculator, δ is entered in mg/(m·h·Pa). Then Z is obtained in (m²·h·Pa)/mg.
Surface diffusion resistances. Constant additions in the same units are used to represent boundary layers at the internal and external surfaces.
Zsi=0.027 (m²·h·Pa)/mg Zse=0.013 (m²·h·Pa)/mg
Distribution through the thickness. The value e(x) at each interface is determined linearly using the share of cumulative diffusion resistance.
e(x)=ein-(ein-eout)·Zcum(x)/Ztot
Step 4. Principle for identifying a possible condensation zone
Criterion. At a point in the construction, condensation is possible if the actual partial pressure exceeds the saturation pressure at the same temperature.
e(x)>Esat(T(x))
Final interpretation. If the green curve is above the red curve over any interval, that interval is classified as a possible condensation zone. If the green curve stays below the red curve everywhere, the steady-state criterion for interstitial condensation is not met.
Practical guidance for interpretation
Where risk most often appears. Critical zones often occur closer to the cold side or at an interface with a low-permeability material. The reason is lower temperature and higher relative humidity in colder regions.
What most strongly affects the result. The green curve is usually most sensitive to δ values and the layer order. An order-of-magnitude error in vapor permeability can noticeably change whether and where the curves intersect.
How to compare options correctly. For a clear comparison, change one parameter at a time. For example, change only insulation thickness or only the vapor-control layer material. This makes it clear what shifts the curves.
FAQs
What does a possible condensation zone mean on the chart
This is an interval where e>Esat. It means that at the given temperature, the pore air cannot hold that amount of water vapor in the gaseous phase, so condensation may occur.
In practice, a zone predicted by a steady-state method does not always mean net moisture accumulation. Final conclusions often require a transient assessment and consideration of drying.
Why is it important to look at both temperature and partial pressure
Condensation depends on two factors. Temperature sets the saturation limit Esat, while diffusion transport determines the actual partial pressure e.
Even with the same indoor and outdoor humidity, changing layer λ and δ can shift the red and green curves in different ways.
Why do the curves often intersect closer to the outdoor side
Closer to the exterior, temperature is lower, so Esat decreases. At the same time, some water vapor from indoors diffuses outward, and e does not always drop as quickly as Esat.
As a result, the probability of intersection (and a possible condensation zone) is usually higher on the cold side.
Can the result be considered accurate for a real wall
This is a simplified steady-state calculation. It works well for an initial check and for comparing build-ups at fixed T and φ.
If you need to assess seasonal accumulation and drying, rain and solar effects, and moisture-dependent material behavior, transient models are used (for example, based on EN 15026 principles).
Which input data most often cause errors
Most often, errors come from vapor permeability δ, especially for films and membranes, and from the layer order (where the vapor control layer is located). The choice of thermal conductivity λ can also matter for materials sensitive to moisture.
For reliability, use material property values from product data sheets and check the units.